VESS
A visual soil-structure score from a spade sample.

Diagnose the cause, plan the work, implement it in the field, monitor the same indicators and improve the next cycle.
The improvement loop
The same sequence guides one farm, a supplier program or a regional portfolio.
The five steps explain when the work happens. The 5M method explains what we improve: Minerals, Microbiology, Organic Matter, Cover and Monitoring. Learn more about the 5M method →
Field evidence
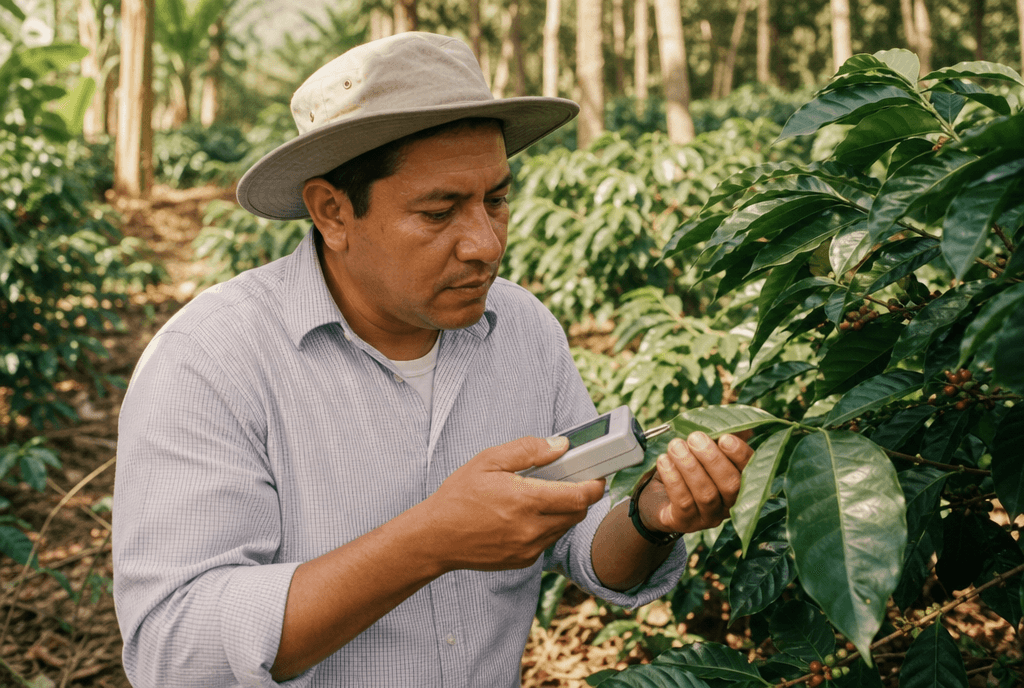
Four field checks reveal structure, compaction, roots and nutrient uptake. A consistent protocol makes visits comparable.
A visual soil-structure score from a spade sample.
Measures how deep and hard compaction is around the roots.
Shows root growth, soil layers and whether aggregates hold together.
Reveals nutrients that exist in the soil but are not reaching the plant.
Use the same GPS point, depth, crop stage and field conditions on each visit. Organize the findings with the 5M method, then compare the treated plot with a control.
Honest by default
Targets are not results. A result is published only after the same indicators have been measured against a baseline and control.
Every pilot includes a comparison plot so change can be attributed.
At least 50 trees per lot, not one hand-picked row.
Early signals can appear in 0 to 3 months. Degraded perennial systems may take 2 to 3 years.
No input sale sits behind the diagnosis or dosage.
Start with a demo and control lot, then watch the evidence build.